| Overview |
| Gravity Loads |
| Lateral Loads |
| Non-Graphical Methods |
|
Powerpoint Illustration (2 MB) |
| Homework Problems |
| Report Errors or Make Suggestions |
Section TA.4
Tributary Areas by Non-Graphical Means
Last Revised: 11/04/2014
When supported members are either not uniformly loaded or not simply supported, then graphical means of determining tributary area are difficult, at best, to obtain. The good news is that the tributary areas can be quantified by mathematical means or mathematical deduction.
There are two basic methods: deductive reasoning and using the results of analysis that follows the load path.
Deductive Reasoning
You can, under certain conditions use deductive reasoning to determine the area tributary to a structural element. This is useful when the geometry along the load path results in members that are not uniformly loaded, but those that they support are.
The criteria for deductive reason are:
- The system surface or sub parts bounded by supporting members are subjected to a uniform pressure.
- The member reactions are readily identifiable (an example might be a single span, simply supported beam that supports a triangular load distribution).
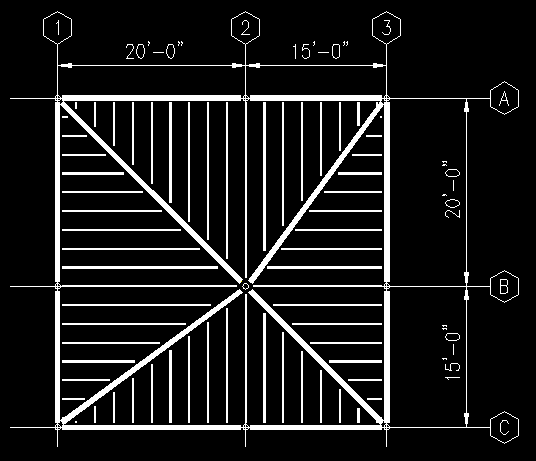
For example, consider the framing system shown in Figure TA.4.1. You can use graphical means for finding the load diagrams on the girders since all the joists are uniformly loaded and simply supported. Click here to view a powerpoint animation illustrating the various girder tributary areas. Try solving for the beam diagram values then click on Figure TA.4.1 to see a graphic with the girder loading results. The example uses a floor pressure of 1 psf.
However, even though all the girders are simply supported they are not uniformly loaded. Each has a linearly varying distributed load that goes to zero at one end if you only consider a pressure load on the floor system and not include girder self weight.
Figure TA.4.1
Example Framing Plan
After solving for girder tributary areas and
loads click on image for results.
We can now use some deductive reasoning to determine the area supported by each of the columns. Lets start with the column at B2.
- Assumptions:
- There is a uniform pressure exerted on the entire surface.
- All structural elements are simply supported, single span beams.
- Observations:
- All four girders supported by column B2 have triangular load distributions, with the peak value occurring at the column.
- A simply supported beam with a triangular load distribution has a reaction at the heavily loaded end equal to 2/3 of the total load supported.
- Each girder supports one end of all the joists in it's quadrant.
- Deductions:
- Each girder supports 1/2 the area in it's quadrant.
- The sum of the girders supports 1/2 the total area of the system.
- Each girder supported by column B2 deposits 2/3 of it's load on the column.
- given the assumptions, the column support 2/3 of the area supported by each girder.
- Column B2 supports 2/3 of the girder tributary areas, which represent 1/2 the total system area, so the column supports 1/3 of the total system area.
- Column B2 Tributary Area = (2/3)(1/2)(35 ft)(35 ft) = 408.3 sqft.
Did you follow that? If not review the logic again.
Let's try the process again for the column located at the intersections of Grids C and 1. The same assumptions used for column B2 apply, as do most of the observations.
- Assumptions:
- There is a uniform pressure exerted on the entire surface.
- All structural elements are simply supported, single span beams.
- Observations:
- All three girders supported by column C1 have triangular load distributions, with the zero value occurring at the column.
- A simply supported beam with a triangular load distribution has a reaction at the lightly loaded end equal to 1/3 of the total load supported.
- Each girder supports one end of all the joists in it's quadrant.
- Deductions:
- The sum of the girders supports the total area bounded by grids 1 & 2 and B & C.
- Each girder supported by column C1 deposits 1/3 of it's load on the column.
- given the assumptions, the column support 1/3 of the area supported by each girder.
- Column C1 supports 1/3 of the girder tributary areas, which represent the total area bounded by grids 1 & 2 and B & C, so the column supports 1/3 of the total area bounded by grids 1 & 2 and B & C.
- Column C1 Tributary Area = (1/3)(20 ft)(15 ft) = 100.0 sqft.
The key to this process is to be observant and use the principles that you know about beam diagrams and supported areas.
Load Path Analysis Results
There are many cases where the criteria for graphical tributary area determination and the criteria for deductive reasoning are not met we can fall back on load path analysis.
The procedure will actually work for all conditions, but requires that you follow the load path from start to finish. Consequently, it is not as useful for determining loads on elements out of sequence.
This method is useful when you need to compute tributary areas but not necessarily identify their locations, say when computing areas for live load reductions.
The procedures goes something like this:
- Identify the framing system.
- Identify the areas where the various pressures are to be applied.
- For each different pressure magnitude
- Do a separate load path analysis.
- Determine the tributary area by dividing reactions by the pressure magnitude.
By this method you can determine the area tributary to elements for each pressure magnitude.
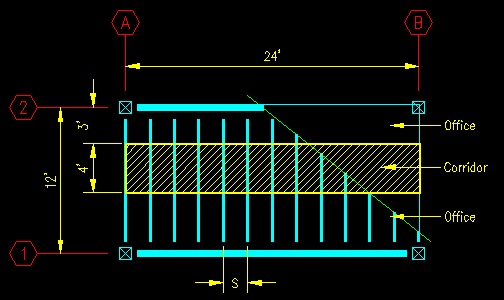
For example, consider the loaded framing plan in Figure TA.4.2. The system supports both office (50 psf) and corridor (100 psf) occupancies where shown on the framing plan.
Figure TA.4.2
Example Framing Plan

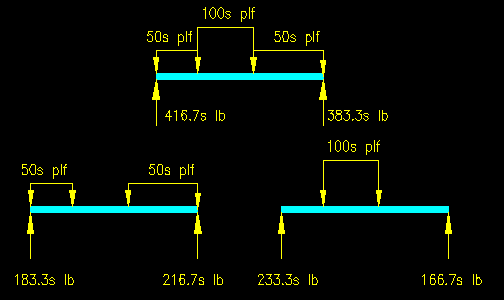
A typical joist load diagram is shown in Figure TA.4.3. It is necessary at this point to split the problem into two load cases: One being the office loading and the other the corridor loading. The associated joist load diagrams are also shown in Figure TA.4.3. Note that in this problem we don't really need to know what the joist spacing is except to design the joists themselves, so we have left the load values in terms of "s".
Figure TA.4.3
Joist Loading Diagrams

The two girders then support the reactions for the joists. As all the joists are the same in span and loading, the load supported on the girders can be characterized as a uniformly distributed load. The magnitudes are:
- Girder on grid 1:
- Office Loading:
- Dist. Load = 216.7s / s = 216.7 plf
- Total Load = 216.7 plf (24 ft) = 5,200 lb
- Office Area Supported = 5,200 lb / 50 psf = 104 sqft
- Corridor Loading:
- Dist. Load = 166.7s / s = 166.7 plf
- Total Load = 166.7 plf (24 ft) = 4,000 lb
- Corridor Area Supported = 4,000 lb / 100 psf = 40 sqft
- Office Loading:
- Girder on grid 2:
- Office Loading:
- Dist. Load = 183.3s / s = 183.3 plf
- Total Load = 183.3 plf (24 ft) = 4,400 lb
- Office Area Supported = 4,400 lb / 50 psf = 88 sqft
- Corridor Loading:
- Dist. Load = 233.3s / s = 233.3 plf
- Total Load = 233.3 plf (24 ft) = 5,600 lb
- Corridor Area Supported = 5,600 lb / 100 psf = 56 sqft
- Office Loading:
Let's do a quick check to make sure that all the area is accounted:
- Total Area = (12 ft)(24 ft) = 288 sqft
- Computed Areas = 104 sqft + 40 sqft + 88 sqft + 56 sqft = 288 sqft
Since the areas are the same, then we have accounted for all the area and our results are most likely correct.
So... now we know how much of each type of area the two girders support. Now we need to determine the areas of each type that are supported by the columns. We will look at the column at the intersections of grids A and 2 for an example. The rest can be similarly determined.
Using a little deductive reasoning, the girders are both uniformly loaded and simply supported so the reactions of one girder are equal to each other and have a magnitude equal to half of the total supported load on the girder. Since we have separated the two load types, we can then deduce that the column supports half of the girder load and therefore supports half the areas of the supported girders.
Alternatively, you can draw beam diagrams as we did for the joists and solve for the girder reactions.
As column supports one end of the girder on grid 2, the end results for column A2 are:
- Office Loading Tributary Area = 88 sqft / 2 = 44 sqft
- Corridor Loading Tributary Area = 56 sqft / 2 = 28 sqft
This method can easily be applied to more complex structures with complex loadings. You just need to create a load case for each type of loading and solve for the reaction forces for all the beams and columns under the influence of just the given load type. The tributary areas for each element are then found by simply dividing the reaction forces by the intensity of the pressure load.
