| Overview |
| Elastic Analysis |
| Plastic Analysis |
| Envelopes |
| Example Problems |
| Homework Problems |
| Report Errors or Make Suggestions |
| Make Donation |
Section CB.4
Envelopes
Last Revised: 08/02/2008
It is the responsibility of the structural engineer to ensure that the structures they design have sufficient strength and stiffness for all possible loading scenarios. This can result in numerous possible load cases for any given structure. For structures with continuity, the problem only gets more involved.
Multiple load scenarios result in multiple load effect (shear, moment, deflection) diagrams for any given member in a structure. To ensure adequate safety and serviceability, "envelopes" of shear, moment, and deflection can be created so as to identify the ranges of possible load effect at every location along a member.
One common example of multiple loading scenarios occurs when a structure is subjected to live load. Live loads can be everywhere, nowhere, or strategically placed. Determining the location of live loads for maximum effect at all possible locations can result in quite a large number of loading arrangements, all of which need to be analyzed.
Computing envelopes can be one of the most tedious tasks of structural analysis for statically indeterminate structural elements. The process requires determining the arrangement of live loads for maximum effects, analyzing the structure for the resulting load arrangements, and then comparing the results to get the envelope values. The process may lead to errors if the engineer is not diligent enough to analyze all the appropriate load arrangements. The process can also lead to an explosion of load arrangements in the interest of thoroughness.
Arrangement of Live Load for Maximum Effect
Consider the three span continuous beam shown in Figure CB.4.1. The beam is to subjected to uniform dead and live load. Using elastic analysis, the moment at any location on the beam equals the moment due to dead load (a load of known location at all times) plus a moment due to live load, strategically placed so as to cause maximum effect at that location.
Figure CB.4.1
Three Span Continuous Beam
The moment diagram for the dead load only case is pretty straight forward. In this case it is a uniform load placed along the entire length of the beam. We can use any of a number of elastic analysis methods to solve for moment diagram. Figure CB.4.2 show the loading and associated moment diagram.
| Figure CB.4.2 Dead Load Only Load and Moment Diagrams |
 |
 |
The dead load moment diagram, in this case, is the basis for the envelope diagram. The live load will either add or subtract to this diagram at each location. The challenge is to arrange the live load for maximum positive and maximum negative moment at each location then do the analysis for each case.
A convenient tool for predicting the appropriate locations to place the live loads is the influence line. Figure CB.4.3 shows the qualitative influence lines for maximum moment at the middle of each span.
Figure CB.4.3
Influence Lines for
Maximum Moment at Midspan
From the influence lines we can deduce where to apply the live load for maximum effect. To get maximum positive moment, load is applied where the influence lines are positive. To get maximum negative moment, load is applied where the influence lines are negative.
Table CB.4.1 identifies the load arrangements needed to find the critical mid-span live load moments.
Table CB.4.1
Arrangement of Live Load
For Maximum Effect at Mid-span
| Span | Positive Moment | Negative Moment |
| 1 | Spans 1 & 3 | Span 2 |
| 2 | Span 2 | Spans 1 & 3 |
| 3 | Spans 1 & 3 | Span 2 |
Note that there are only two unique load cases for maximum mid-span moment. Next, take a look at the moments at the two interior supports. Figure CB.4.4 shows the influence lines for these cases.
Figure CB.4.4
Influence Lines for
Maximum Moment at Supports
Table CB.4.2 identifies the load arrangements needed to find the critical support live load moments.
Table CB.4.2
Arrangement of Live Load
For Maximum Effect at Mid-span
| Support | Positive Moment | Negative Moment |
| 1 | Span 3 | Spans 1 & 2 |
| 2 | Span 1 | Spans 2 & 3 |
In this case we end up with an additional four unique load cases. This brings us to six unique arrangement of live load that need to be considered (i.e. analyzed). Figure CB.4.5 shows the six cases.
Figure CB.4.5
The Six Critical Live Load Cases
Solving each of these cases and combining the results with the dead only cases results in six different moment diagrams. Figure CB.4.6 is a graph of the resulting moment diagrams for all six load cases. The dead load only case has been left as a heavier line.
Figure CB.4.6
Moment Diagrams for All Six Cases
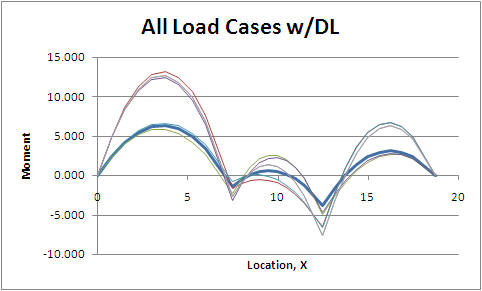
Note that no one moment diagram defines the upper or lower bound across the entire three spans. It has been necessary to do all six analysis. Figure CB.4.7 shows just the upper and lower bounds for moment along the beam. This is a moment envelope diagram. Note that the moment on the beam will ALWAYS be between the upper and lower bounds. These are the critical values needed for design.
Figure CB.4.7
Moment Envelope
Similar approaches are taken the develop envelopes for other load effects such as shear or deflection. The basic steps are the same:
-
Identify the necessary load cases using influence lines
-
Analyze each of the load cases
-
For each location along the member, determine the upper and lower bound values and graph them.
By some astute observation it is possible to come up with other approaches to the problem. One such approach is presented in the next section.